A recent systematic review of more than 3500 scientific publications has investigated whether these many studies agree on the relationship between depressive symptoms and patient behaviour collected from wearable devices. The study shows that some behaviour is strongly correlated to changes in depressive symptoms.
Recently, an increasing amount of research has been trying to find ways to detect changes in depressive symptoms by monitoring the patient's behaviour using mobile and wearable technology. For example, a number of studies have shown a significant correlation between e.g. mobility patterns as tracked by GPS and the level of depression. Similarly, correlations between sleep patterns and depressive symptoms have been shown.
"Now we know both what behavioural features correlate with depression, and how significant this correlation is. With this, we are in a much better position to design personal health technology for mental health."
Darius Adam Rohani and Jakob E. Bardram [1]
However, many of these studies have been non-conclusive and even contradictory.
In a recent study by researchers from CACHET, which has just been published in the high impact Journal of Medical Internet Research, have found a list of specific behaviours that are always correlated with depressive symptoms. Box 1 shows the top 10 actions that are associated with depressive symptoms; item in the left column are negatively correlated and items in the right are positively correlated. This means, for example, that increased number of phone calls are correlated with lower depressive symptoms whereas an increased amount of time spend at home seems to correlated with increased depressive symptoms.
Wearables - a powerful way to track behaviour
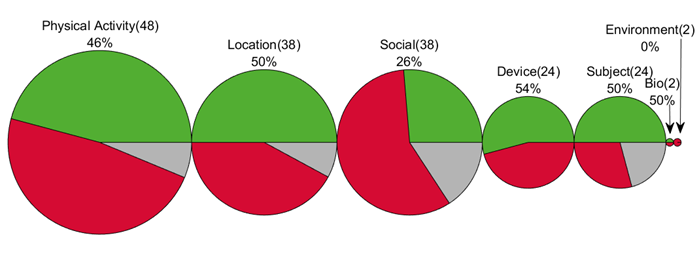
The researchers found 46 studies that for the past ten years have used mobile and wearable devices to monitor depressive symptoms. When combining all the studies and their results, the researchers were able to show that an impressive amount of 85 different behaviours was tracked using 17 different sources and sensors. They showed that the 85 behaviours could be categories into seven different categories, and from these, physical activity was the most tracked behaviour, closely followed by social behaviour and mobility.

The size of each circle represents the number of behaviours, while the green, red, and grey portion represents the number of times the behaviours were either significant, nonsignificant or undocumented correlation to depressive symptoms respectively.
List of activities that are associated with depressive symptoms. The left side are behaviour that is negatively correlated (increased behaviour shows lower depressive symptoms), while the right side are behaviour that is positively correlated (increased behaviour shows higher depressive symptoms).
|
Negative correlation (lower depression)
|
Positive correlation (increased depression)
|
|
Receive SMS
|
Amount of time you spend at home
|
|
Duration of phone calls (outgoing)
|
Duration of phone calls (incoming)
|
|
Number of phone calls (outgoing)
|
Number of phone calls (incoming)
|
|
Activity (steps, energy expenditure)
|
The time your smartphone screen is turned on
|
|
Move around to different phone cell towers
|
Sleep duration*
|
|
Entropy (more even time each location visited)
|
Your heart rate during sleep
|
|
Circadian movement (same mobility pattern as previous days)
|
How much your heart rate changes (variability)
|
|
Number of locations visited
|
|
*Only for clinically diagnosed
- Rohani DA, Faurholt-Jepsen M, Kessing LV, Bardram JE. Correlations Between Objective Behavioral Features Collected From Mobile and Wearable Devices and Depressive Mood Symptoms in Patients With Affective Disorders: Systematic Review. JMIR Mhealth Uhealth 2018;6(8):e165. DOI: 10.2196/mhealth.9691. PMID: 30104184